 TV Market Data /
Online Video Usage in Asia-Pacific (2010)
April 2010 |  Comscore ComscoreOnline Video Usage in Asia-Pacific (February 2010)
“Online video viewing has become an essential part of the digital consumer experience in the Asia-Pacific region, with nearly 4 out of 5 Web users viewing online video each month,” said Will Hodgman, comScore’s executive vice president for the Asia-Pacific region. “comScore Video Metrix offers publishers, advertisers and their agencies competitive intelligence into the online video viewing marketplace, providing critical insights about the audiences engaging in this behavior. As the lines between TV and online video continue to blur, it is increasingly important for marketers to understand these audiences and how to reach and engage them effectively.”
Singapore Posts Highest Video Penetration, Japan Users Most Engaged
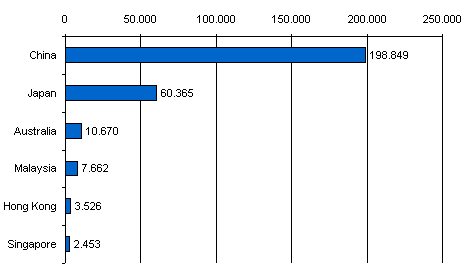
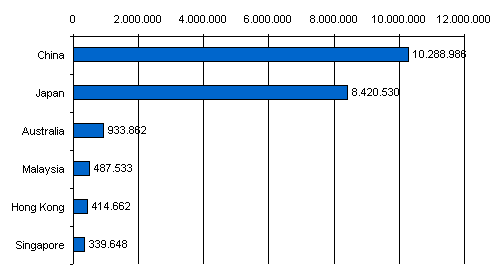
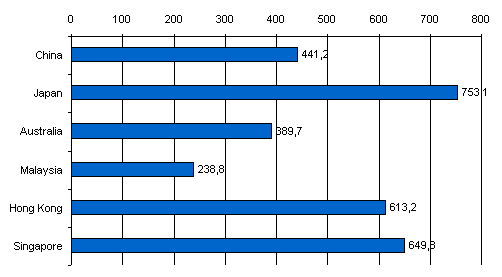
Videos Viewed (000) Despite having smaller overall video viewing audiences, Singapore (87.6 percent) and Hong Kong (87.4 percent) boasted the highest penetration of video viewers among their respective Internet populations. Both markets also exhibited high engagement with viewers averaging more than 10 hours of online video during the month.
Minutes per Viewer
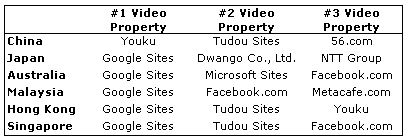
YouTube Makes Google Sites Top Video Property in Most Asia-Pac Markets Google Sites, driven predominantly by video viewership at YouTube.com, was the top video destination according to the number of videos viewed in all markets except China, which was led by three local Chinese video properties Youku, Tudou Sites and 56.com. In Japan, Google Sites ranked first, followed by local property Dwango Co., Ltd. (which includes Nicovideo.jp) and NTT Group (which includes OCN.ne.jp). In Australia, Microsoft Sites captured the number #2 spot, followed by Facebook.com. Facebook.com ranked among the top three video properties in Malaysia, Australia and Singapore, while Tudou Sites ranked second in China, Hong Kong and Singapore.
Top 3 Video Sites (per region)
Related Resources:
____________________________________________________________
____________________________________________________________
____________________________________________________________
____________________________________________________________
____________________________________________________________
____________________________________________________________
____________________________________________________________
____________________________________________________________
____________________________________________________________
____________________________________________________________
____________________________________________________________
____________________________________________________________
____________________________________________________________
____________________________________________________________
|
![]()
© 2007-2010 by itve.org |
search |
legal |
contact
| supported by:


 Australia